Regional Geography
of Argentina
Outline
- Physical Characteristics
- Relative location of Argentina
- Landscape and Physical Environment of South America
- Weather and climate of South America
- Human Characteristics
- Population, Density and Age/Sex characteristics of Argentina and the U.S.
- Language and religion of South America
- Cultural/ethnic groups of South America
- Economic Characteristics
- Major economic activities in Argentina
- Imports and Exports of Argentina
- GNP and GNP per capita of Argentina
- References
Physical
Characteristics
Relative Location of Argentina :
Argentina is located in South America,
south of the Isthmus of Panama, the thin strip of land that separates South
America from its North American counterpart (Finlayson 2016, 86). The country
is made up of 23 provinces, including Cordoba, Misiones and Rio Negro along
with the autonomous city of Buenos Aires, which is also the country’s federal
capital. Argentina’s home continent of South America sits in the earth’s Southern
Hemisphere, just below the Equator. In terms of landmass, the continent is
approximately twice the size of the United States (NationMaster.com 2003, 1).
Landscape and Physical Environment of South America:
Argentina’s home continent of South America
is covered by a long chain of mountains that are known as the Andes Mountains
to the west. This mountain chain was formed by the eastward-moving plates,
known as the Cocos and the Nazca Plates, as they plunged beneath the three
continental plates, the North American, Caribbean and South American Plates, at
a drawn-out subduction zone. To the east, a wide landmass of lowlands stretch
from the Andes Mountain Range to the Atlantic Ocean. In other areas of these
lowlands, grasslands cover massive, flattened expanses including the Ilanos of Venezuela and Colombia along with the Pampas in
Argentina. The greatest feature of the South American lowlands, however, is the
Amazon Basin, or the Amazon Rainforest, which is the world’s largest tropical
rainforest and is famous for its biodiversity. The Amazon Basin is drained by
the Amazon River and its tributaries (Pulsipher & Pulsipher 2007, 118-121).
Weather and Climate of South America:
Astoundingly various climates cover South
America. The varied climates result from factors including the distance the
landmass spans on either side of the Equator, the continent’s mountainous spine
which creates dynamic altitudes and global wind patterns and ocean currents
that result in unique precipitation patterns in the region. South America is
divided into four temperature-altitude zones: Tierra Caliente (hot lands) where
temperatures are the warmest, Tierra Templata
(temperate lands) where there is spring-like climate year-around and Tierra
Fria (cool lands) where midlatitude-climate and cool-weather crops are grown
and modern population centers exist. Finally, the last temperature-altitude
zone that is present is the Tierra Helada (frozen
lands). In this zone, grain and root vegetables are grown and animals are
raised for food and fiber. Higher up in this zone, mountain tops emerge from
under snow and glaciers. Precipitation patterns throughout South America are
influenced by global wind patterns such as the “trade winds,” which are blown
from the northeast and southeast toward the equator. In addition to these trade
winds, topographic barriers such as the Andes Mountains and nearby, adjacent
ocean currents also influence annual precipitation on the continent. Last of
all, due to its geographic location right next to the Atlantic Ocean, South
America puts itself in danger every year when a hurricane forms over the Ocean.
The hurricanes form as a group of unorganized thunderstorms that, when warming,
wet air reaches an important stage and organizes the thunderstorms into a swirl
of winds that move across the Atlantic from east to west before striking the
continent (Pulsipher & Pulsipher 2007, 121-122).
Human
Characteristics
Population, Population
Density & Age/Sex Characteristics of Argentina and the U.S.:
According to the Population Reference Bureau, the population
of Argentina as of mid-2019 was roughly 44.9 million people as opposed to the
U.S.’s population at this time which was about 329.2 million people (Population
Reference Bureau, 2020). This makes the U.S.’s population approximately 7.5
times larger than Argentina’s. In addition, according to the 2019 World
Population Data Sheet, Argentina’s population density is 115 people per square
kilometer of Arable Land (Population Reference Bureau, 2019). This population
density of Argentina is compared to the U.S.’s population density of 216 people
per square kilometer of Arable Land (Population Reference Bureau, 2019). Using
these terms, this makes the U.S.’s population density about twice the size of
Argentina’s. As of 2019, the percentage of Argentina’s population that is under
age fifteen is 25% while the population of the U.S. that is under age fifteen
is only 19% (Population Reference Bureau, 2020). On the opposite side of this
data is the percentage of people that are ages sixty-five and up. In Argentina,
11% of the population is aged sixty-five and above while the percentage of the
U.S. that falls under this age group is 16%, as of last year (Population
Reference Bureau, 2020). Furthermore, the sex ratio in Argentina is around
95.03 males per 100 females (Knoema.com, 1). In the U.S., this ratio is about
97.87 males per 100 females (Knoema.com, 1). These ratios both come from data
gathered in 2015. Finally, as of last year, the total fertility rate of
Argentina is 2.3 (Population Reference Bureau, 2020) while the U.S.’s total
fertility rate comes to 1.7 (Population Reference Bureau, 2020).
Languages of South
America:
South America has approximately 600 languages belonging to
about 16 different language families that come from their Native populations
that date back up to 12,500 years ago (Hobbs 2008, 535). The 16 different
families include the Quechu-Aymaran language family
that belonged to the Incas (Hobbs 2008, 535). More than 7 million people today
still speak one of the five languages in this family (Hobbs 2008, 535).
Indigenous languages are used much more in South America than elsewhere in
Latin America (Hobbs 2008, 535). The European languages of the continent arrived
in the late 15th Century with colonizers (Hobbs 2008, 535). Language
distribution today reflects the pattern of colonial rule, with Spanish being
the most widespread throughout the continent (Hobbs 2008, 535). Other languages
on the continent include Portuguese, French, Chinese, English, Hindi, Arabic,
Dutch and Italian, (especially in Argentina), (Hobbs 2008, 535). Finally,
Creole languages also developed as a result of black slavery on the Middle and
South American coasts of the Atlantic Ocean (Hobbs 2008, 535).
Religion of South America:
Roman Catholicism
was not only introduced, but imposed as the one and only acceptable faith in
the New World (Hobbs 2008, 537). 80% of the continent’s population are Catholic
(Hobbs 2008, 537). British and Dutch settlers brought their Protestant faiths
(Hobbs 2008, 537). Currently, Protestant branches such as Evangelical and
Pentecostal faiths are making their way into traditionally Catholic communities
throughout the South American continent (Hobbs 2008, 537).
Cultural/Ethnic Groups:
Even though the dominance in Latin American of culture
traits are derived from Europe, a significant number of the original European
settlers and their descendants married Native and black populations (Hobbs
2008, 537). Latin and South American countries including Costa Rica, Argentina
and Uruguay are the only countries with large, white, European ethnic groups
today (Hobbs 2008, 537). Many scattered districts with mostly European origins
still exist in other countries (Hobbs 2008, 537). Black Latin and South
Americans of relatively unmixed African ancestry live mainly on the Caribbean
Islands or on the Atlantic coastal lowlands of Middle and South America (Hobbs
2008, 537). This is because these regions with higher black populations were
the areas that African slaves were originally brought to work on sugar
plantations by European settlers (Hobbs 2008, 537). In South America, most
European groups originally came from countries including Spain, Portugal,
France, Great Britain, Italy and Germany, (especially in Argentina).
Pertaining specifically to Argentina, there has been a
history of a multitude of indigenous peoples who have inhabited the country.
Indigenous groups of Argentina include the Querandi
and the Guarani who inhabited the pampas of the north, the Pehuenches,
Puelches and Mapuche who
inhabited the Lake District and Patagonia, the Selk’nam,
Haush, Yahgan and Alacaluf who lived in and around Tierra del Fuego and the Diaguita who inhabited the Andean foothills (Albiston et al., 2018, 578). Today, only a small fraction
of Argentina’s population is of indigenous descent.
Economic
Characteristics
Major Economic Activities
in Argentina:
Argentina’s
economy includes a wide-ranging variety of activities and sectors. The main
activities of the Argentine economy include agriculture, livestock, fishing,
industry, mining and power and transport and communication (Farber 2020, 1). In
addition to these activities, Argentina’s primary economic sectors are
business, social and other types of services which make up 33.3% of the
country’s GDP, manufacturing, making up 17.2% of GDP and commerce and tourism,
which make up 16.9% of GDP (Pariona 2017, 1).
Imports and Exports of
Argentina:
Major
exports of Argentina include soybean meal at $11.9 billion, delivery trucks at
$3.88 billion, soybeans at $3.84 billion, corn at $3.7 billion and soybean oil
at $3.62 billion (Pariona 2017, 1). The leading countries that Argentina sends
its exports to are Brazil at $14 billion, China at $4.51 billion, the U.S. at
$4.15 billion, Chile at $2.85 billion and Venezuela at $1.98 billion (Pariona 2017, 1). On the other hand, Argentina’s main
imports include petroleum gas at $5.55 billion, refined petroleum at $3.92
billion, cars at $3.5 billion, vehicle parts at $3.21 billion, and telephones
at $2.03 billion (Pariona 2017, 1). The majority of
Argentina’s imports come from Brazil at $14.3 billion, China at $10.7 billion,
the U.S. at $8.73 billion, Germany at $3.44 billion and Bolivia at $2.56
billion (Pariona 2017, 1).
GNP and GNP per capita of
Argentina:
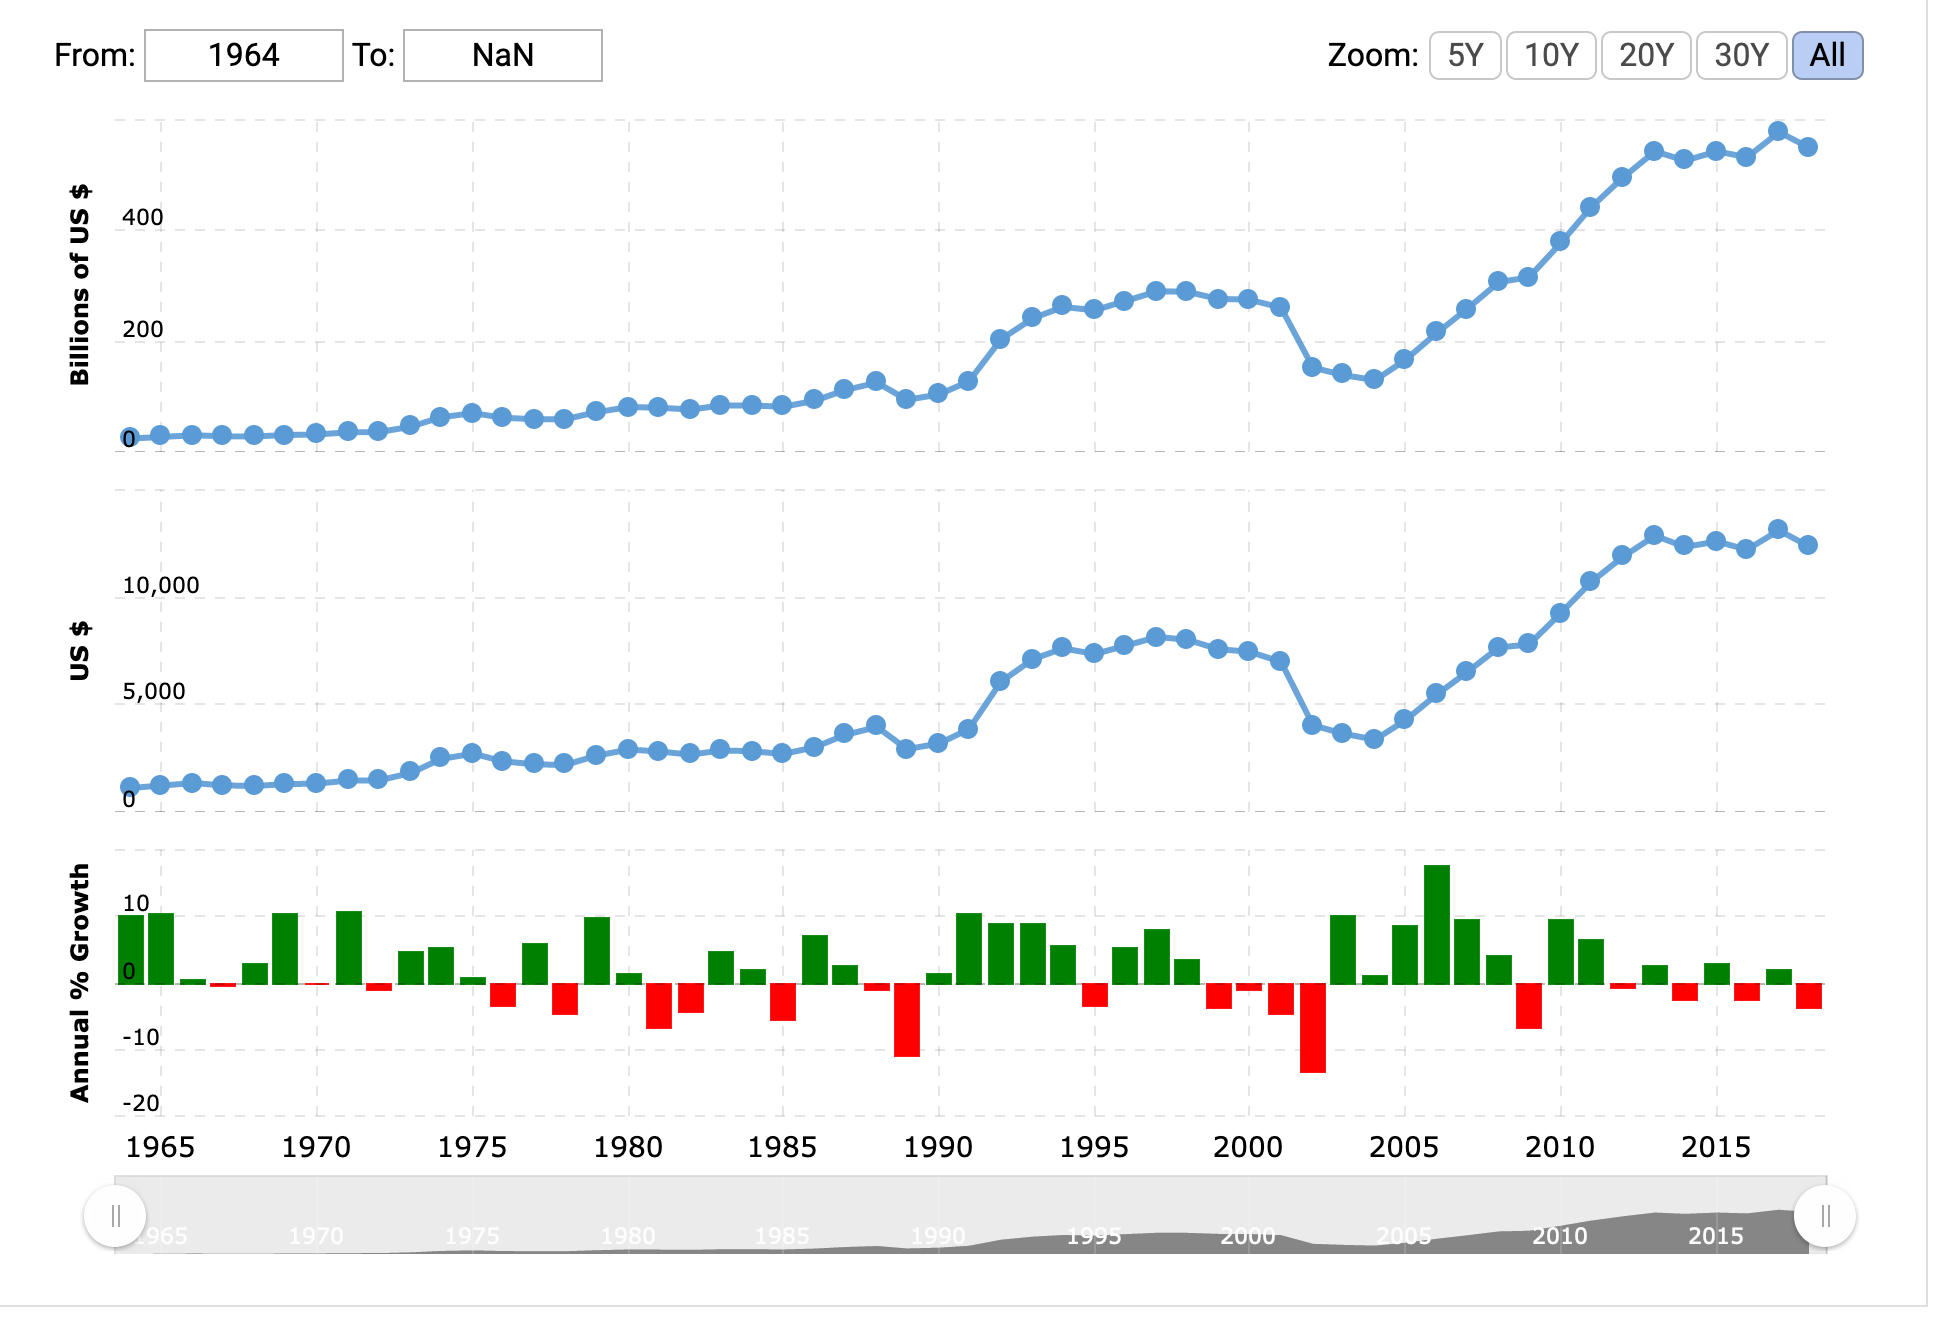
This graph depicts patterns of growth and decline of Argentina’s GNP and GNP per capita from 1964 to 2020. Generally, from 1964 to 1985, we see that Argentina’s GNP and GNP per capita slowly grew, little by little (Macrotrends LLC. 2010, 1). According to this graph, the country’s GNP and GNP per capita saw it biggest dips in the late 1980’s and early 2000’s (Macrotrends LLC. 2010, 1). After both dips, Argentina’s GNP and GNP per capita rose again (Macrotrends LLC. 2010, 1). Most recently, Argentina’s GNP dropped from $577.97 billion in 2017 to $550.33 billion in 2018 while during the same time period, GNP per capita fell from $13,120 to $12, 370 (Macrotrends LLC. 2010, 1). This drop in Argentina’s GNP and GNP per capita represents a growth rate of -3.64% from 2017 to 2018 (Macrotrends LLC. 2010, 1).
References
Albiston, I. Brown, C. Clark, G. Egerton, A. Grosberg, M. Kaminski, A. McCarthy, C. Mutic, A. Skolnick, A. “Lonely Planet: Argentina.” Edition 11. Lonely Planet. August 2018. Printed in Singapore.
Argentina GNP 1964-2020. (2010). Retrieved April 18, 2020, from https://www.macrotrends.net/countries/ARG/argentina/gnp-gross-national-product
Argentine or Argentinian vs United States Geography Stats
Compared. (2003). Retrieved April 18, 2020, from
https://www.nationmaster.com/country-info/compare/Argentina/United-States/Geography
Data Center: International Indicators. (2020). Retrieved April
18, 2020, from https://www.prb.org/international/geography/argentina/
Data Center: International Indicators. (2020). Retrieved
April 18, 2020, from https://www.prb.org/international/geography/united-states
Farber, M. E., Raizboim-Farber I.
N. surdelsur.com, E. E. de. (2019, June 9). Economic Activities in Argentina •
El Sur del Sur. Retrieved April 18, 2020, from
https://surdelsur.com/en/economic-activities-argentina/
Finlayson, C. (2016). World Regional Geography .
Minneapolis, MN: Open Textbook Library.
Hobbs, J. J. (2008). World Regional Geography. United States: Cengage
Learning.
Pariona, A. (2016, December 16).
The Economy Of Argentina. Retrieved April 18, 2020, from
https://www.worldatlas.com/articles/the-economy-of-argentina.html
Pulsipher, L. M., & Pulsipher, A. (2007). World
Regional Geography. W H Freeman & Co.
United States of America Male to female ratio, 1950-2018. (n.d.). Retrieved April 18, 2020, from https://knoema.com/atlas/United-States-of-America/topics/Demographics/Population/Male-to-female-ratio
2019 World Population Data Sheet
Submitted by Spence Bridgman on April 18, 2020.